Features · The month
Know you are overspending while there is still month left.
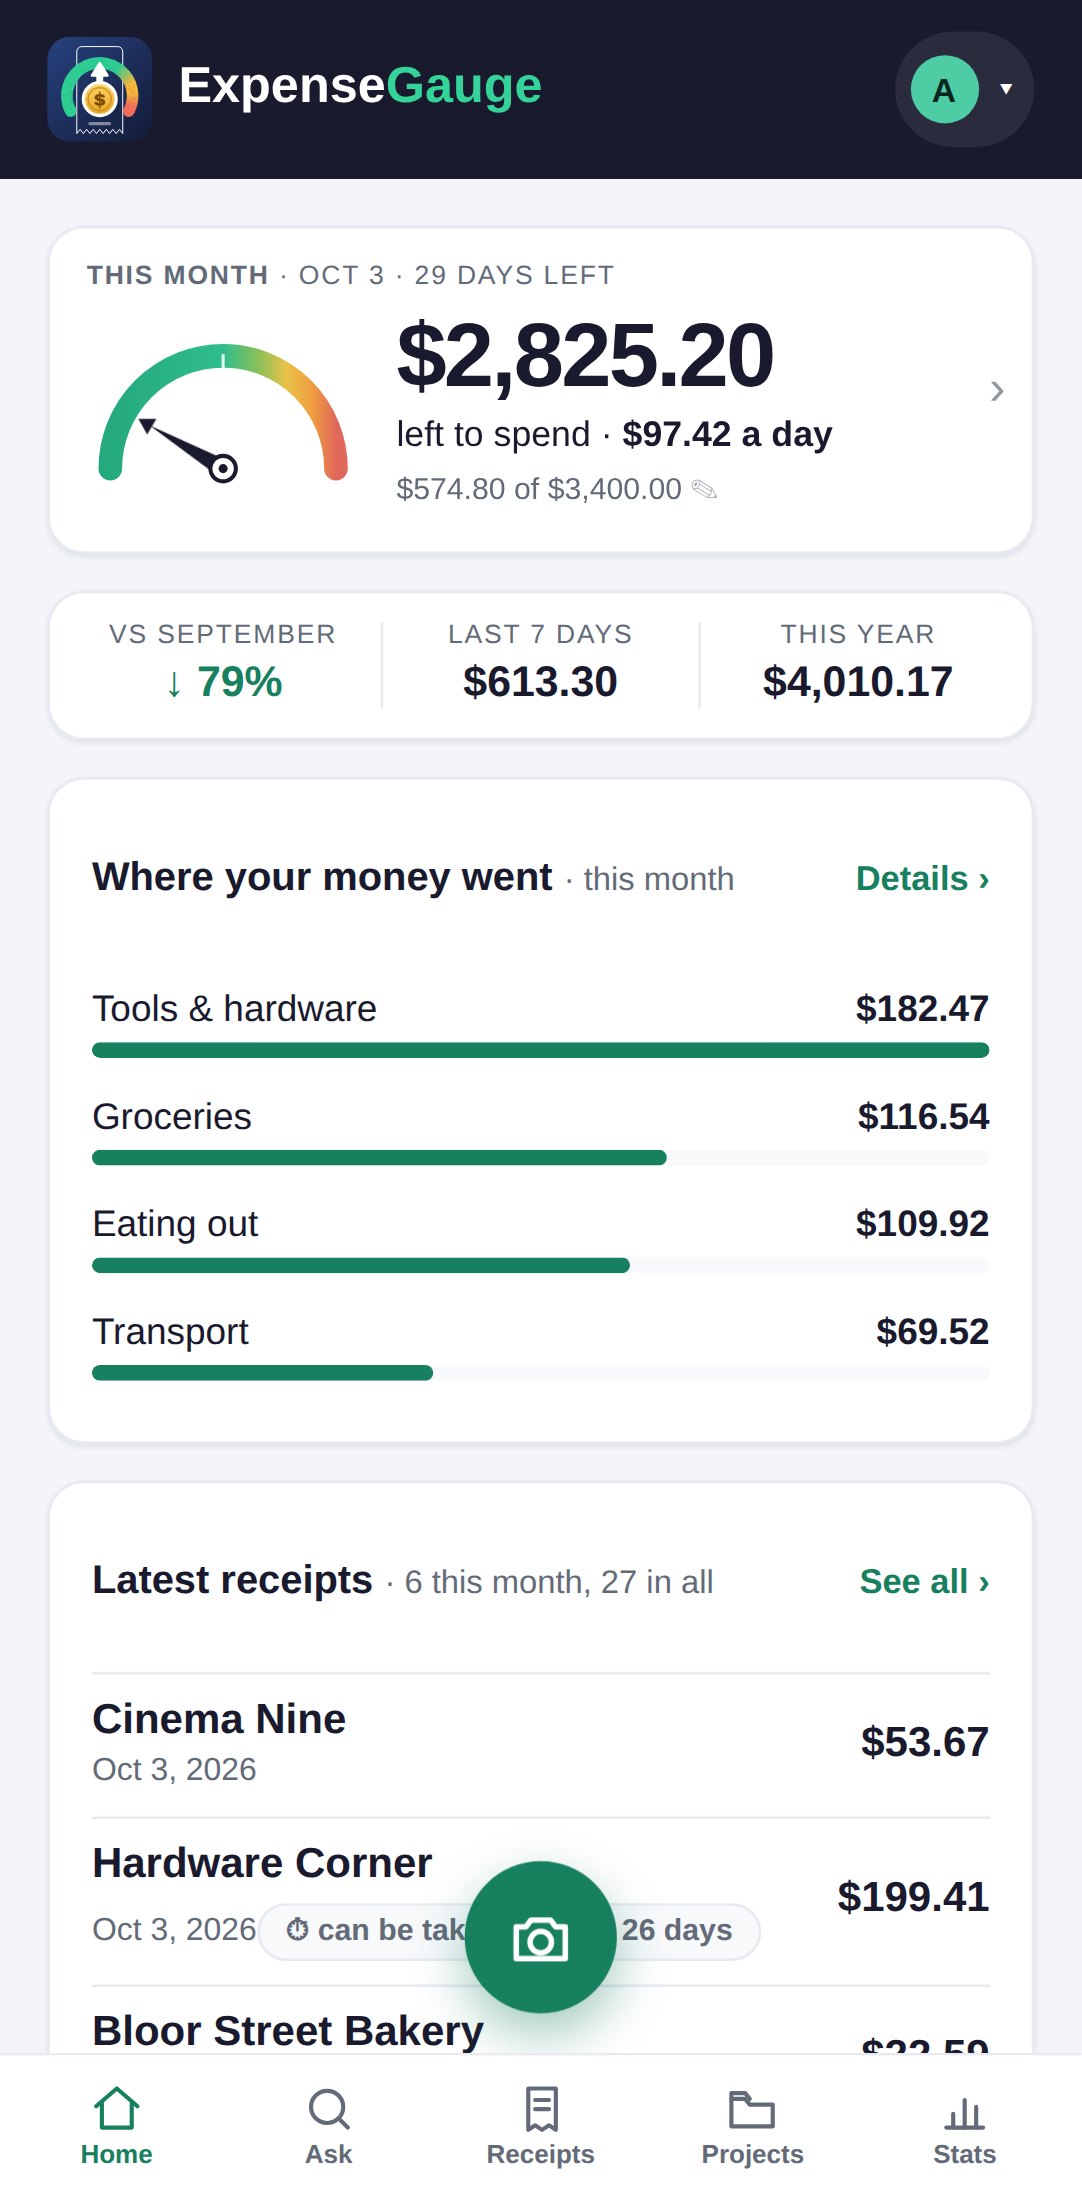
A total at the end of the month is a post-mortem. Give the month a figure and the home screen becomes a gauge: what is left, what that comes to for each day still to go, and a warning when the pace you are spending at is heading past it.
No password. You sign in with a six-digit code sent to your email. The free plan is not a trial — see pricing.
How it works
One figure, and the app does the arithmetic every day.
Set the month’s figure
On the home screen, tap the line with the pencil at the foot of the month card and type a figure. Each month can have its own; empty the box to remove it.
Spend as usual
Every receipt, statement line and fixed cost counts the day it was paid, in the money it was paid in.
Read the gauge
What is left, what that is a day, and — once the pace is heading past the figure — a warning in one sentence, while there is still time to do something about it.
Where it went
Pockets, not a pile.
The month is split into pockets — groceries, eating out, transport, household, tools — built from the lines of each receipt, so one supermarket trip can feed three pockets. Each has a bar, and the largest come first.
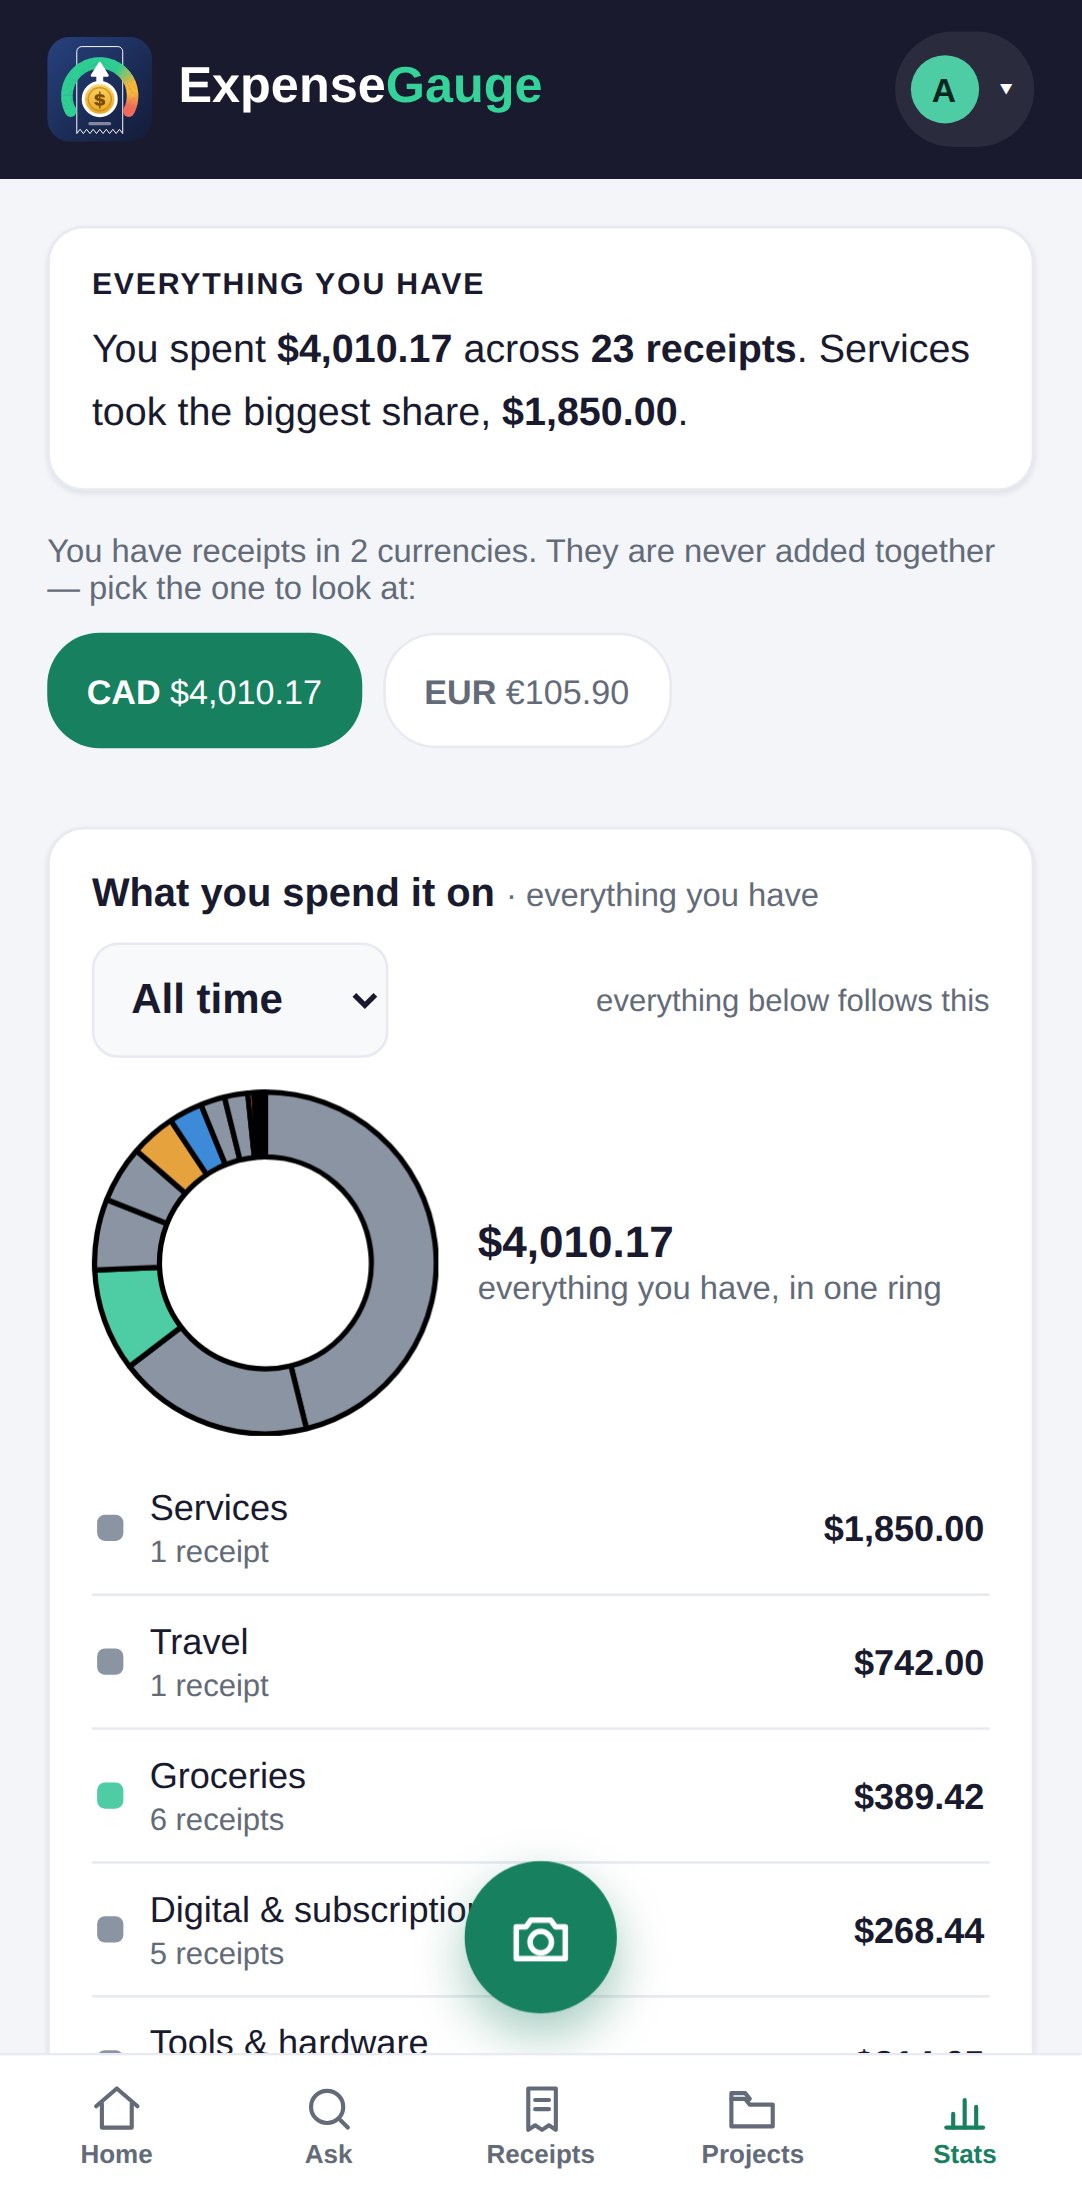
The Stats screen goes further: a ring of the whole month or the whole year, month by month for the last twelve, a limit for any pocket you want to watch, and the price of things you buy again, so you can see what has gone up.
The rest of it
Small things that make the figure honest.
Against your own usual
Compared with last month and the last seven days, so a big month is seen as big for you, not against an average.
Fixed costs included
Rent and bills you told the app about count in the month they are due, so the figure left is the figure really left.
Refunds come off
A return or a refund reduces what you spent, in the month it came back.
Other currencies apart
A trip in euros is not folded into dollars at a made-up rate. Each currency keeps its own total.
Straight answers
Common questions
How do I set a monthly budget?
On the home screen, tap the line with the pencil at the foot of the month card and type the figure. The box is called Monthly budget. A budget belongs to one month, so a different month can have a different figure.
What does the gauge show?
What is left of the month’s figure, what that comes to a day for the days still to go, and how much has been spent so far against it.
When does it warn me?
When the rate you are spending at is heading past the figure. A little over is not news; it speaks up when it matters.
Can I set a limit for one category?
Yes. On the Stats screen, set a limit for any pocket you want to watch.
Do I have to set a budget at all?
No. Without one, the home screen still shows what you spent this month, how that compares with last month, and where it went.
Where next
Give this month a figure.
It takes ten seconds, and the next twenty-nine days look different.
Read next: Fixed costs · Ask about your spending · Where the month went